
Backtest Portfolio: Validate Your Allocation With Data
Most portfolio decisions get made on vibes. Backtesting is what separates a plan you defend with evidence from one you adjust every time the market burps. This guide covers the workflow, the metrics that matter, and the pitfalls that turn a great-looking equity curve into live losses.
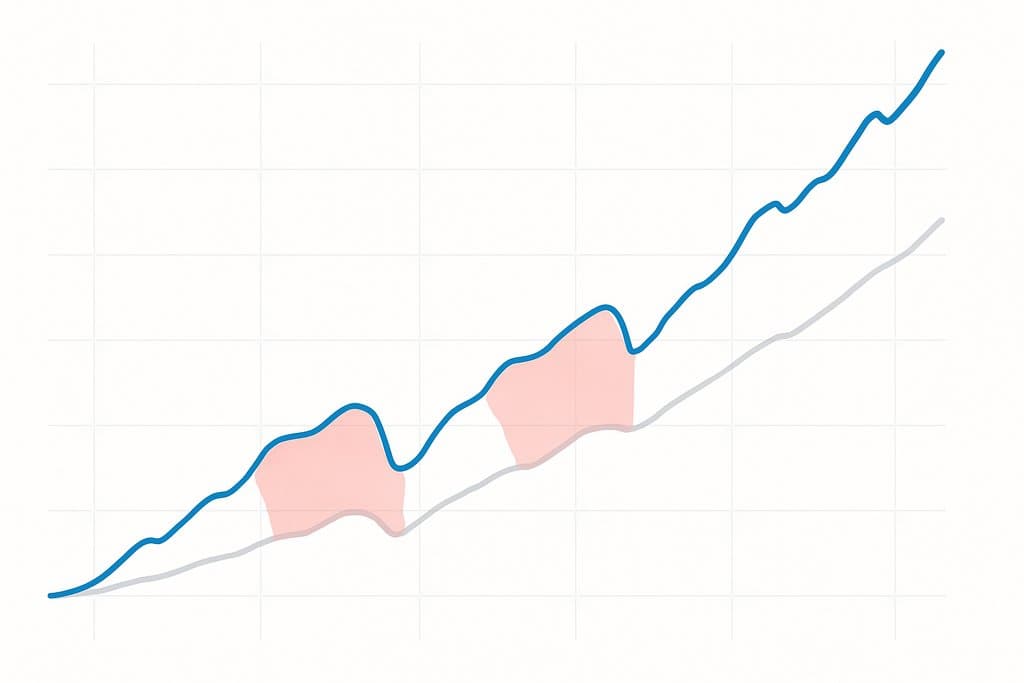
Most portfolio decisions get made on vibes. Backtesting is what separates a plan you defend with evidence from one you adjust every time the market burps. This guide covers the workflow, the metrics that matter, and the pitfalls that turn a great-looking equity curve into live losses.
Portfolio backtest versus strategy backtest
A strategy backtest evaluates entry and exit rules on one instrument or a small basket. A portfolio backtest evaluates allocation logic across many assets, rebalancing schedules, and risk controls. The math overlaps but the questions differ.
Examples of portfolio-level questions: Does risk parity beat 60/40 across the last three decades? Does adding a 10 percent gold sleeve reduce drawdown enough to justify the carry drag? What happens if I overlay a volatility-based reduction rule on top of a target allocation?
The seven-step workflow
A repeatable process beats clever one-off tests. Use this on every idea.
| Step | What you do | Why it matters |
|---|---|---|
| 1. Frame | Write the objective in one sentence | "Cut drawdown while keeping 80% of returns" is testable. "Improve returns" is not |
| 2. Define | Asset universe, allocation logic, rebalance frequency, risk limits | Without specifics, your test is opinion |
| 3. Data | Survivorship-free, dividend-adjusted, multiple regimes | 15+ years for strategic allocation, daily granularity for tactical |
| 4. Costs | Commissions, spreads, slippage, taxes if applicable | A frictionless backtest is fiction |
| 5. Run | Compute equity curve and full metric set | Save the trade list, not just the summary stats |
| 6. Validate | Out-of-sample, walk-forward, scenario stress | If it only works on the development sample, it does not work |
| 7. Iterate | One hypothesis-driven change at a time | Each change must be explainable in economic terms |
Metrics that matter
A single number rarely tells the whole story. Look at multiple dimensions.
Return and path
Annualized return tells you the destination. The shape of the cumulative return curve tells you whether you would have actually stayed invested. Two portfolios with identical CAGRs can feel completely different to the investor holding them.
Drawdown and recovery
Maximum drawdown is the worst peak-to-trough loss. Recovery time is how long it took to make new highs. A strategy that loses 35 percent and recovers in 18 months is a different product from one that loses 22 percent and recovers in 6 months.
Risk-adjusted return
Sharpe ratio compares excess return to total volatility. Sortino isolates downside volatility. Calmar (return / max drawdown) emphasizes the path. Use multiple. A 1.8 Sharpe with a 50 percent drawdown is a different beast from a 1.2 Sharpe with a 15 percent drawdown.
Stability
Run the strategy across subperiods: pre-2008, 2008-2010, 2011-2019, 2020-2022, 2023+. If returns come entirely from one window, you have a regime-specific bet, not a robust strategy.
Turnover and implementability
Annualized turnover indicates trading cost drag. Check whether your rules trade enough volume to clear at your size without moving the market. A backtest at 100k can degrade meaningfully at 5M.
Pitfalls that inflate apparent performance
Every one of these has wiped out real money.
Look-ahead bias
Your backtest uses information that was not available at decision time. Common cause: end-of-day price for an intraday rule, or revised earnings instead of the originally reported number. Align signals and execution with realistic lags.
Survivorship bias
The equity universe excludes companies that delisted, went bankrupt, or were acquired. Historical results look better than reality because losers vanished. Use point-in-time index membership data.
Overfitting
Tuning parameters to maximize past performance until the curve looks pristine. You captured noise. Keep models simple, prefer parameter plateaus over single peaks, validate out-of-sample.
Cost optimism
Skipping commissions, spreads, slippage, or tax drag. Results that exclude friction are rarely achievable. Model spreads that scale with liquidity and turnover.
Regime blindness
A single period hides sensitivity to regime shifts. Run scenarios: low rate / high rate, low vol / high vol, growth / value, dollar strength / weakness. A robust portfolio holds up across all four.
Aim for broad parameter plateaus where moderate parameter changes still produce acceptable performance. Sharp peaks on the optimization grid are usually mirages.
Allocation methods, ranked by complexity
Static. Equal weight, cap weight, 60/40, target risk. Rebalanced on a fixed schedule. Often the hardest to beat after costs.
Risk-based. Risk parity, minimum variance, maximum diversification. Depend on covariance estimates. Sensitive to lookback window and shrinkage.
Signal-driven. Factor tilts, trend overlays, regime-aware rotation. Higher expected return at the cost of complexity and turnover.
Optimization-based. Mean-variance, Black-Litterman. Powerful in theory, often fragile in practice because input estimation errors get amplified. Regularize aggressively.
Stress overlays. Rules that cap equity weight when realized vol exceeds a threshold. Improve ride quality at a small expected-return cost.
A worked example: three variations on a 60/40
| Variation | Allocation rule | What you test |
|---|---|---|
| Vanilla 60/40 | 60% SPY, 40% AGG, rebalance monthly | Baseline |
| Risk parity | Inverse 6-month volatility weights, monthly | Does smoother risk distribution improve Sharpe? |
| Momentum tilt | 70/30 if 12-month SPY return is positive, 50/50 otherwise, monthly | Does trend confirmation help? |
Pull 20+ years of monthly total return data for SPY and AGG. Apply 5 bps slippage and 1 bp commission per trade. Compute volatility, Sharpe, max drawdown, and time underwater for each variation. Compare across subperiods (2003-2007, 2008-2010, 2011-2019, 2020-2024).
Typical findings: risk parity reduces drawdown depth with similar returns; momentum tilt boosts returns in strong trends but adds turnover and underperforms in chop. Which is best depends on what you can stomach.
From backtest to live execution
A backtest that never becomes a deployment is intellectual exercise. Two paths from validation to live capital.
Code-first. Python, broker API, your own scheduler. Maximum control, real engineering work. Worth it if your strategy depends on bespoke logic or alternative data.
Platform. Obside lets you express the portfolio in plain language, run the backtest in seconds, and route orders through your connected broker. Same rule set from research to live. Examples:
- "Keep 50 percent BTC, 25 percent ETH, 25 percent USDC. Rebalance weekly. Pause rebalancing if daily volatility exceeds 5 percent."
- "Hold 60 percent SPY, 30 percent AGG, 10 percent GLD. Rebalance on the first business day of each quarter or on 5 percent drift."
- "Sell all positions if the S&P 500 drops 10 percent intraday. Restore when it recovers 5 percent from the low."
- "Alert me if 60-day correlation between SPY and AGG exceeds 0.5."
Ready to validate your portfolio with real data?
Pick one allocation rule you actually use. Run the seven-step workflow. If the data holds up across regimes and after costs, automate it. Obside Copilot accepts plain-English portfolio rules, returns a backtest in seconds, and runs the same logic live on your broker. Smart alerts, instant backtests, broker connection — all in one place.
Create your free Obside account and validate your first portfolio rule today.
Educational content only. This is not investment advice. Investing involves risk, including possible loss of capital.
FAQ
For strategic allocation, at least 15 to 20 years of monthly data covering a full cycle (bull, bear, recovery). For tactical rules, daily granularity across several volatility regimes. More history is not always better if regimes have structurally changed (e.g., pre-2008 vs post-2008 bond behavior).
Related articles
Try Obside on your portfolio
Connect your broker and automate your strategy with a prompt.
Get started