
Backtesting Software: How to Pick, Use, and Trust It
Backtesting is the bridge between an idea you believe in and a strategy you risk capital on. Pick the wrong software and you get a beautiful equity curve that dies in week one of live trading. This guide covers the criteria that matter, the pitfalls that inflate apparent performance, and the workflow that turns research into deployable code (or no-code).
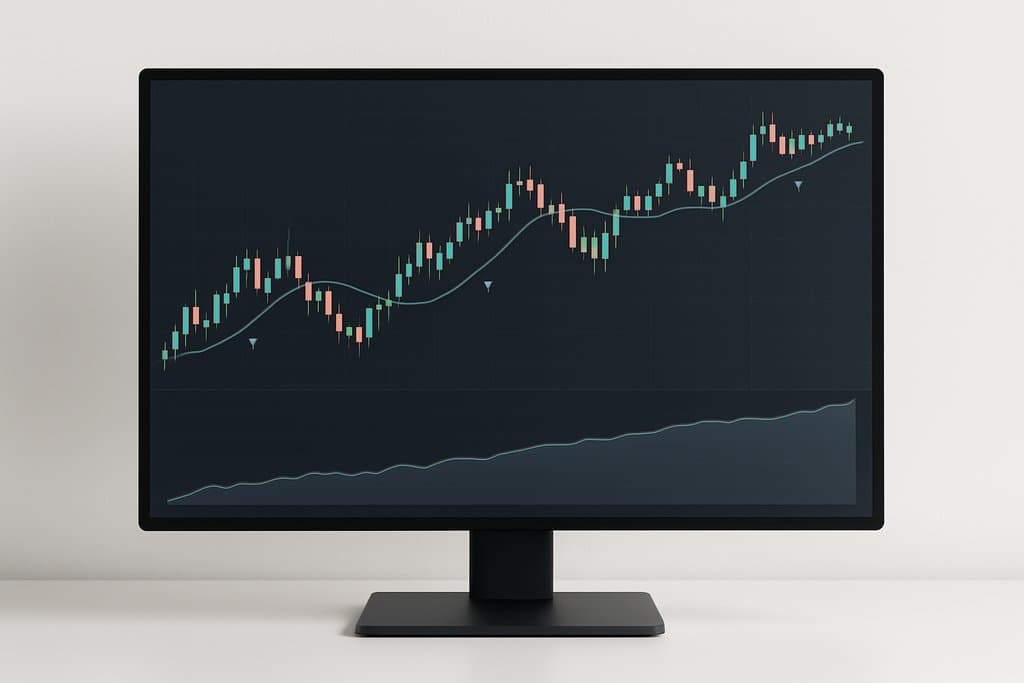
Backtesting is the bridge between an idea you believe in and a strategy you risk capital on. Pick the wrong software and you get a beautiful equity curve that dies in week one of live trading. This guide covers the criteria that matter, the pitfalls that inflate apparent performance, and the workflow that turns research into deployable code (or no-code).
What backtesting software actually does
A backtester simulates your rules on historical data and reports what would have happened. Given entry conditions, exit conditions, sizing, and stops, it produces a trade list, equity curve, and statistics: CAGR, max drawdown, Sharpe, Sortino, hit rate, profit factor, exposure.
Quality tools do more than draw curves. They ingest accurate market data, model fills with slippage and spreads, handle portfolio rules and risk controls, and let you inspect trades and regime behavior. The difference between a toy and a serious backtester is realism — how closely the simulation tracks the live conditions you would actually face.
Eight criteria for picking the right tool
| Criterion | What to verify | Red flag |
|---|---|---|
| Data quality | Survivorship-free equities, tick or accurate intraday for FX/crypto, dividend adjustments | No documentation of data sources |
| Execution realism | Configurable slippage, spreads, order types, partial fills, latency | Close-only fills assumed |
| Speed | Backtests run in seconds, not hours | Hour-long runs on simple rules |
| Expressiveness | Can combine price, indicators, fundamentals, news, alt data | Locked to a small set of indicators |
| Research-to-live | Same logic deploys without rewriting | Backtest in tool A, live in tool B |
| Diagnostics | Trade lists, heatmaps, parameter sensitivity | Only summary stats, no trade-level detail |
| Ease of use | No-code or low-code for non-engineers, SDK for engineers | Steep learning curve before you produce results |
| Cost and ecosystem | Pricing fits your size, community of templates | Per-test pricing that kills iteration |
Pick the tool that shortens your iteration loop. The best backtester is the one you actually use, weekly, to evaluate new ideas.
The modern workflow
Professional research follows roughly this sequence. Skip steps and you ship a backtest that lies to you.
- State a falsifiable hypothesis. "When 2h RSI rises above 50 and Supertrend on 2h and 8h is bullish, longs have positive expectancy after fees on EURUSD."
- Define the universe and timeframe. Specific assets, specific bars, specific dates. Reserve at least 30 percent of history for validation.
- Codify rules and risk controls. Entry, exit, stops, take-profits, sizing, portfolio caps.
- Run the baseline. Realistic slippage, commissions, latency. Record performance and failure modes.
- Validate out-of-sample. Freeze rules and run on the held-out history. Performance should degrade by less than a third.
- Probe robustness. Walk-forward, parameter sweeps, Monte Carlo on trade sequences.
- Paper trade. Two to four weeks with live data and paper orders. Catches operational issues that static backtests miss.
- Deploy small. 25 percent of intended size for the first month. Monitor slippage and fill quality versus backtest assumptions.
The pitfalls that wipe out real money
Data snooping
You tweaked parameters on the same data until the curve looked perfect. You captured noise. Keep parameters coarse, validate out-of-sample, and walk forward.
Look-ahead bias
Your signal uses information that was not available at decision time. Common cause: using the bar's close to enter at the open, or revised earnings instead of original. Align signals and execution with realistic lags.
Survivorship bias
Your equity universe excludes delisted or bankrupt companies. The losers vanished, so backtest results look better than reality. Use point-in-time index membership.
Unrealistic fills
Close-to-close fills with zero slippage. Fantasy for any high-turnover strategy. Model spreads that scale with liquidity and slippage that widens during volatile periods.
Over-optimization
Sharp peaks on the optimization grid usually mean overfitting. Aim for broad parameter plateaus where moderate parameter changes still produce acceptable performance.
A backtest is proof your idea survived contact with the past under defined conditions. It is not a guarantee of the future. Build for robustness, not the highest historical Sharpe.
Three example strategies and what good software reveals
Technical momentum
Entry: 50-period SMA crosses above 200-period on a 1-hour chart, RSI below 70. Exit: 2 ATR stop, 3 ATR target. Quality software reports more than total return. It shows average trade duration, equity curve over time, worst intra-trade drawdown, sensitivity to ATR multipliers, and behavior across volatility regimes.
Event-driven
Entry: buy oil when a credible hurricane signal hits and WTI breaks above 95 with confirmed volume. Hold three days unless WTI spikes beyond a threshold. The tool must ingest event data with accurate timestamps and align with market data. Realistic fill modeling matters because news widens spreads.
Portfolio rebalancing
Allocation: 50/25/25 BTC/ETH/USDC, weekly rebalance with 5 percent drift bands. Quality software accounts for trading costs at the portfolio level, models drift bands accurately, and reports both portfolio-level drawdowns and correlation impacts — not just per-asset returns.
A 30-minute first backtest you can run today
| Step | Action |
|---|---|
| 1 | State the rule in one paragraph |
| 2 | Set realistic costs: 5 bps slippage, 1 bp commission, conservative spread |
| 3 | Implement entries, exits, and a safety rule (close if volatility triples vs 20-bar baseline) |
| 4 | Reserve 30 percent of history for validation |
| 5 | Run baseline. Record CAGR, drawdown, Sharpe, profit factor, hit rate |
| 6 | Sensitivity check on stop and target ratios |
| 7 | Walk-forward across 3 to 5 folds |
| 8 | Monte Carlo on trade sequences for worst-case drawdown |
| 9 | Paper trade for two weeks |
| 10 | Deploy at 25 percent of target size |
Where Obside fits
If your goal is speed from idea to live execution, Obside compresses the whole loop into one conversation. You describe the rule in plain English, the engine returns a backtest in seconds, and the same logic deploys to your connected broker without rewriting code.
Examples that work end-to-end:
- "When 2h Supertrend turns bullish and 2h RSI is below 70, buy with a 5 ATR trailing stop. Close on Supertrend flip."
- "Buy 50 of Bitcoin every Monday at 10:00 AM."
- "Alert me if RSI crosses 70 on EUR/USD and MACD turns bearish."
- "Sell all positions if the S&P 500 drops 10 percent intraday."
- "Keep 50 percent BTC, 25 percent ETH, 25 percent USDC, rebalanced weekly."
The platform won the Innovation Prize 2024 at the Paris Trading Expo and is backed by Microsoft for Startups.
Honest considerations
Backtests are models, not reality. Markets change, liquidity vanishes, correlations jump. Overfitting is a constant risk, especially with many parameters and weak validation. Costs act like gravity on short-term systems.
Be honest about operational capacity. If your edge requires sub-second execution and you cannot achieve it live, the result is not actionable. Many "great backtest" strategies die in production because the engineer building the bot is not the trader running the account.
Ready to ship from idea to live in minutes?
Pick one rule you believe in. Run the 30-minute backtest. If it survives validation, deploy small. Obside Copilot accepts plain English, returns a backtest in seconds, and routes orders through your broker — no code required.
Create your free Obside account and ship your first backtested rule today.
Educational content only. This is not investment advice. Trading involves risk, including possible loss of capital.
FAQ
Accuracy depends on the strategy and assumptions. Intraday or event-driven systems need high-quality intraday data, realistic slippage, and event alignment. Swing or portfolio strategies need accurate corporate actions and portfolio simulation. The best tool mirrors your live execution conditions most closely.
Related articles
- Backtest portfolio: validate your allocation with data
- Forex backtesting: validate your strategy with data
- Investment strategies: build, backtest, automate
- Trading news hub: turn headlines into confident decisions
- Social trading: learn, copy, and automate strategies
- AI investing: practical strategies that work
Try Obside on your portfolio
Connect your broker and automate your strategy with a prompt.
Get started