
W Pattern Trading: Trade Double Bottoms With Discipline
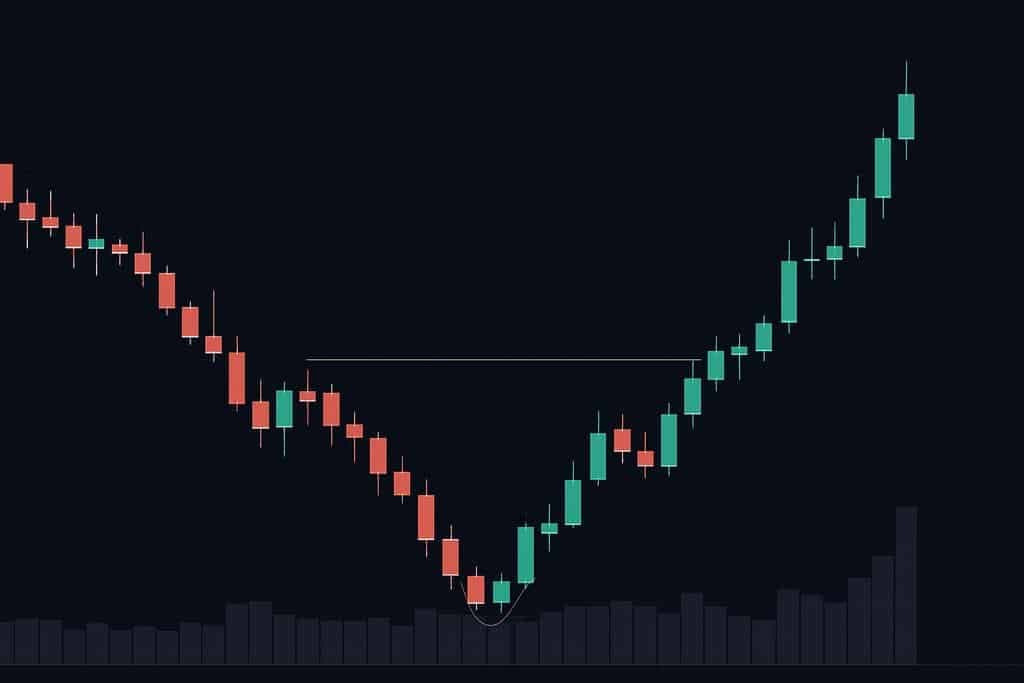
The W pattern — a double bottom — is the long-side mirror of the M pattern. Two troughs at similar levels, a swing high between them, a break above that swing high to confirm reversal. The structure is clean, the rules are mechanical, and the failure modes are predictable.
The W pattern — a double bottom — is the long-side mirror of the M pattern. Two troughs at similar levels, a swing high between them, a break above that swing high to confirm reversal. The structure is clean, the rules are mechanical, and the failure modes are predictable.
What separates traders who profit on W patterns from traders who feed liquidity is patience around the neckline break, discipline at the stop, and a regime check that filters out the most common false signals.
The mechanics of the W pattern
The W pattern is a two-trough reversal that forms after a downtrend. The first low marks initial buying interest. Price bounces to a swing high (the neckline). It returns toward the first low and stalls. Sellers fail to push below the first trough with conviction. Price then breaks above the neckline.
That break is the confirmation. Late shorts cover, new longs enter, and the reversal often produces a clean directional move equal to the pattern's height.
The mirror pattern is the M pattern (double top), with identical logic in the opposite direction.
What makes a tradeable W pattern
Not every two-low formation is a tradeable W. The criteria:
- Prior downtrend of 5%+ on the trading timeframe. Reversal patterns need something to reverse.
- Two troughs within 1–4% of each other for liquid large caps and FX, wider for crypto and small caps.
- A clear neckline — the intermediate high, defined and not cluttered.
- Volume contracts on the second trough, suggesting seller exhaustion.
- Volume expands on the neckline break — conviction in the new direction.
- Bullish RSI divergence at the second trough — momentum already turning.
Patterns missing 2+ of these criteria degrade fast. Skip them.
Entry: breakout close vs retest
The two viable entry tactics:
| Entry style | Trigger | Pros | Cons |
|---|---|---|---|
| Breakout close | First close above the neckline on your timeframe | Captures the initial impulse | Wider stop, higher whipsaw risk |
| Retest entry | Wait for price to pull back to the neckline, hold as support, print a bullish reversal | Tighter stop, better R:R | ~40% of clean breaks don't retest, missed move |
Pick one tactic per setup. Hybridizing — entering on the close, then second-guessing on the retest — produces worse results than either alone.
An intrabar spike above the neckline is not confirmation. Wait for the close on your trading timeframe.
Stop placement and targets
Initial stop: just below the second trough, ideally with a 0.5–1×ATR buffer to avoid getting wicked out by normal noise.
Measured target: the pattern height (distance from lowest trough to neckline), projected upward from the breakout. A 5% pattern projects a 5% target.
Realistic exit ladder:
- TP1 at 50% of measured target
- TP2 at the full measured target
- Trail the rest with 2–3×ATR if momentum carries
Layer with structure. If a key resistance level sits at 70% of the measured target, partial profits there usually make sense.
Timeframe and market context
The W pattern shows up on every timeframe. Reliability scales with timeframe.
- Daily / 4-hour: cleanest signals, lowest false-positive rate
- 1-hour: noisier, stricter confirmation needed
- Below 1-hour: requires volume expansion and ATR-based stops
Market-specific notes:
- FX: macro releases create neckline fakeouts. Avoid trading patterns near NFP, FOMC, CPI.
- Crypto: weekend liquidity gaps exaggerate retests. Validate on weekday volume.
- Equities: an earnings print near the second trough is a strong reversal catalyst; one near the neckline is dangerous because the gap can sweep your stop.
Worked examples
BTC on 4-hour
BTC falls from $74,000 to $67,800. Bounces to $70,600. Returns to $68,100. 4-hour RSI on the second low is higher than on the first — bullish divergence. Price pushes back above $70,600 on expanding volume.
- Neckline: $70,600
- Entry: 4h close at $70,800 (long)
- Stop: $67,500 (~1 ATR below second trough)
- Pattern height: $2,800
- Target: $73,400 (measured move)
- R:R: ~1:0.8 to TP1, ~1:1.5 to TP2 if you scale
EUR/USD on 1-hour
After a multi-day decline, EUR/USD prints a low at 1.0770. Bounces to 1.0815. Returns to 1.0775. Breaks above 1.0815 as MACD crosses bullish.
- Conservative trader waits for a retest of 1.0815, sees it hold, enters on a bullish engulfing
- Stop: below 1.0770 by a few pips
- Measured target: ~1.0860
Confirmation filters that improve W trades
Adding 1–2 filters lifts the average trade quality substantially.
- Bullish RSI divergence at the second trough — single most valuable filter
- Breakout volume > 1.2× the 20-period average — conviction signal
- Higher-timeframe support nearby — daily support at the W's lows confirms institutional interest
- Price closes above a key moving average (50 or 200) — regime alignment
Don't stack all four. Two well-chosen filters out-perform a kitchen-sink stack that overfits historical data.
Common failure modes
Three patterns repeat in W-pattern losses:
- Front-running the breakout — entering before the close above the neckline. ~40% of "almost" breaks don't follow through.
- Triple-bottom risk — sometimes the structure extends into a third trough. Respect your stop.
- Trading the pattern in a downtrend that hasn't bottomed — the W can form and fail multiple times before the real reversal. A regime filter (e.g., daily MACD turning up, ADX falling) reduces these.
Automating W-pattern detection
Manually scanning charts for clean W patterns across a watchlist is tedious and error-prone. Obside scans for you.
Describe the detection logic to Obside Copilot in plain English:
"Scan S&P 500 daily charts. Identify W patterns where two lows are within 3% of each other, formed 3–8 weeks apart, with bullish RSI divergence at the second low. Alert me on a daily close above the neckline with volume > 1.5× the 20-day average. On confirmation, buy 0.5% equity, stop 1×ATR below second low, target the measured move."
Copilot translates that to executable rules, runs an instant backtest, and runs the scan live across your universe. You can switch between alert-only and auto-execute per strategy.
Create a free Obside account to scan hundreds of instruments for valid W patterns, with alerts and automated execution that only fire on real confirmation.
Educational content only. This is not investment advice. Trading involves risk, including possible loss of capital.
FAQ
Yes. Same structure, same psychology, same confirmation rules. The "W" label is the visual nickname.
Related articles
- M Pattern Trading: Master the Double Top Strategy
- RSI Indicator: How It Works, Settings, and Strategy
- Technical Analysis: Read Markets Like a Pro
- Trading Strategy: Build, Test, and Automate Rules That Last
- Day Trading Strategies: Proven Setups and Risk Rules
- Trading Automation: From Idea to Real-Time Execution
Try Obside on your portfolio
Connect your broker and automate your strategy with a prompt.
Get started